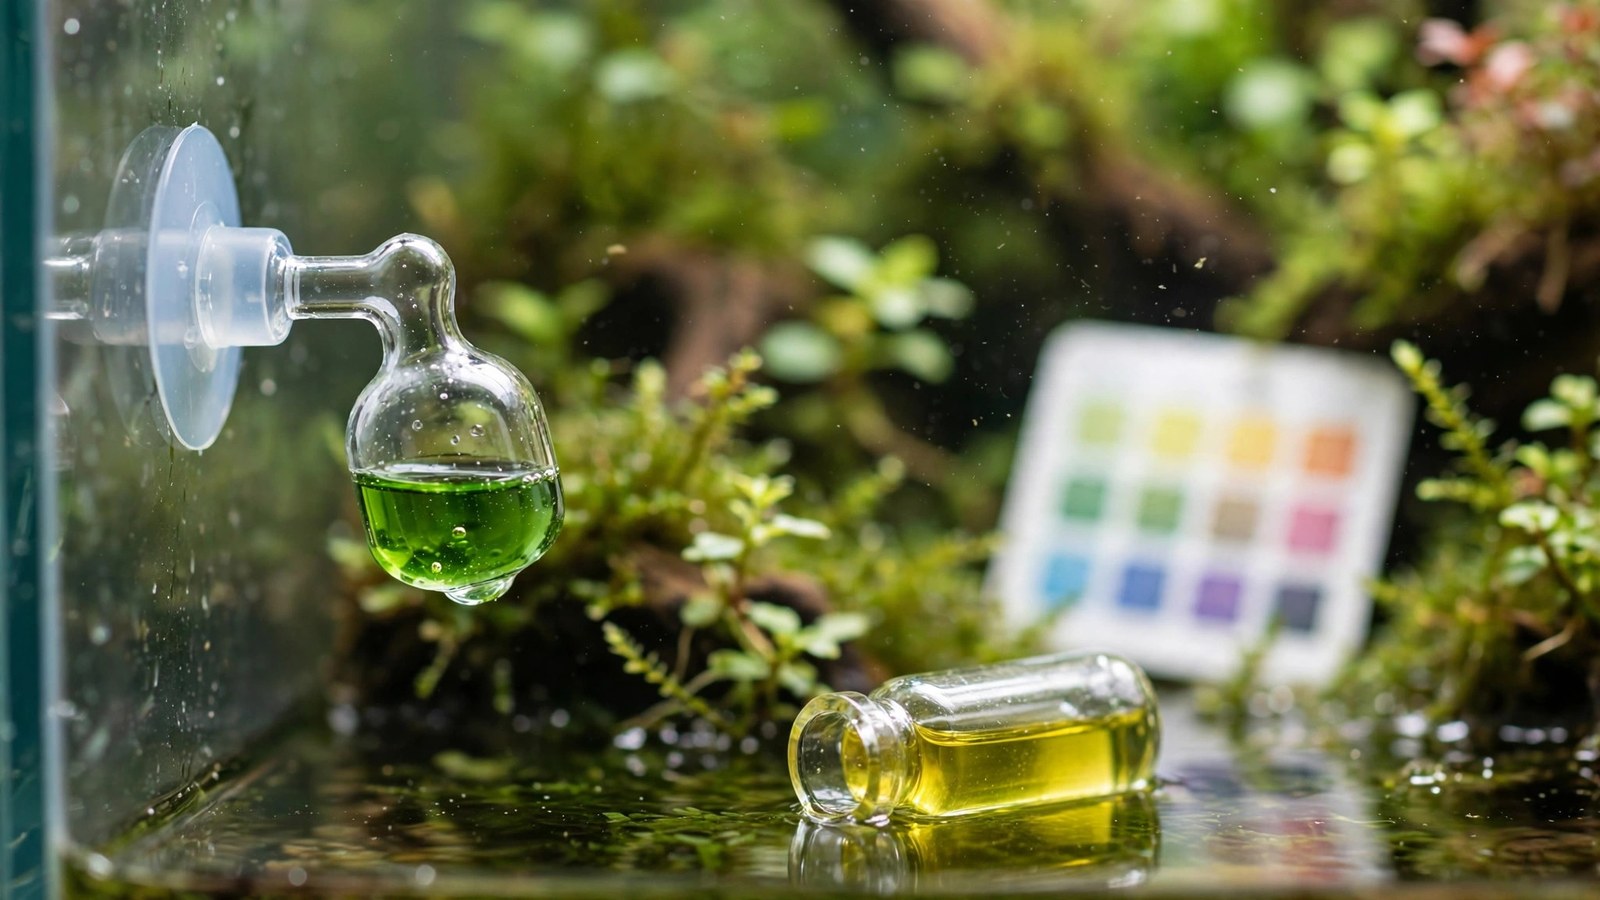
Long before drop checkers became a fixture on planted-tank glass, aquarists estimated dissolved CO2 with nothing more than two liquid test kits and a lookup table. The ph kh co2 chart is that table: take your pH reading, take your KH (carbonate hardness) reading, and the intersection tells you roughly how much CO2 is dissolved in your water. It is elegantly simple — and that simplicity is exactly why you need to understand where it works and where it lies to you. Used with honest eyes, it is still a genuinely useful tool.
What the pH/KH/CO2 Chart Actually Is
The chart is a table of calculated values that translate two easy measurements — pH and KH — into one hard-to-measure value: dissolved CO2 in parts per million (ppm), which for aquarium purposes equals mg/L. It was popularized in the hobby by Chuck Gadd, whose classic chart generations of aquarists have photocopied, screenshotted, and pinned to forum threads.
The Chemistry in Plain Words
Here is the only chemistry you need to understand this chart. Dissolved CO2 in water forms carbonic acid (H2CO3), which lowers pH. Meanwhile, carbonate and bicarbonate in the water — measured as KH — act as a buffer that resists pH change. The relationship between CO2, pH, and KH follows the carbonate equilibrium equations, and solving them gives a simple formula:
CO2 (ppm) = 3 × KH (in dKH) × 10(7 − pH)
Read the formula in plain language: more KH means more buffering, so the same pH drop implies more CO2 dissolved. A lower pH at constant KH means more carbonic acid, which means more CO2. Every 1.0 drop in pH at constant KH corresponds to roughly ten times more CO2 — notice the exponent, not a multiplier.
The chart is this formula pre-computed into a grid: rows of pH, columns of KH, CO2 in the cells. But the whole structure rests on one critical assumption: carbonate must be the only buffer in the water. Hold that thought — it is the single biggest thing that makes the chart lie.
How to Measure pH and KH Properly
A chart fed with sloppy readings produces sloppy estimates. Getting the inputs right matters more than understanding the math.
Test kits beat strips
Use liquid reagent test kits for both pH and KH, and check that they are in date — expired reagents drift, especially pH indicators. Dip strips are too coarse; the chart's exponent means a pH reading that is off by 0.2 produces a CO2 estimate that is off by more than 50 percent.
Calibrate and double-check pH
If you use a pH pen or probe, calibrate it with fresh buffer solution before trusting any number. With liquid kits, test in daylight or under a neutral white lamp, since the color comparison is subjective. Run the pH test twice — if your two readings disagree by more than 0.2, run it a third time before charting anything.
Take readings at the same time of day
CO2 levels in a planted tank swing through the day, and pH moves with them. Take your pH and KH readings at the same time each day, ideally a couple of hours after the CO2 has been running and lights are on, so you are measuring a representative mid-photoperiod value. A pH reading at 8 a.m. paired with a KH reading at 8 p.m. is not valid.
KH testing tips
KH liquid kits count drops until the color flips. The endpoint is subtle — test over a white card in strong light, and add drops slowly near the end. Record KH in degrees (dKH). Most tap-water KH lands between 2 and 8 dKH, which is a comfortable range for this method.
Worked Examples: Running the Numbers Yourself
Let us verify the formula with concrete numbers. The pattern to internalize: at a fixed KH, each 0.2 step down in pH multiplies the CO2 estimate by about 1.58.
| pH | KH (dKH) | Calculation | ≈ CO2 (ppm) |
|---|---|---|---|
| 7.0 | 4 | 3 × 4 × 100 = 3 × 4 × 1 | 12 |
| 6.8 | 4 | 3 × 4 × 100.2 = 3 × 4 × 1.585 | 19 |
| 6.6 | 4 | 3 × 4 × 100.4 = 3 × 4 × 2.512 | 30 |
| 6.4 | 3 | 3 × 3 × 100.6 = 3 × 3 × 3.981 | 36 |
| 7.0 | 3 | 3 × 3 × 100 = 9 × 1 | 9 |
| 6.8 | 3 | 3 × 3 × 100.2 = 9 × 1.585 | 14 |
| 6.6 | 2 | 3 × 2 × 100.4 = 6 × 2.512 | 15 |
Check the arithmetic on the flagship examples: 3 × 4 × 1 = 12 ppm. 3 × 4 × 1.585 = 19.02, so ≈ 19 ppm. 3 × 4 × 2.512 = 30.14, so ≈ 30 ppm. 3 × 3 × 3.981 = 35.83, so ≈ 36 ppm. Most high-tech planted tanks target roughly 25–35 ppm of dissolved CO2; fish stress symptoms typically begin well above 40 ppm. But a number is a reference point, not a goal — never chase it blindly, which we will cover in the safety routine below.
The Degassed-Baseline pH-Drop Method
There is a second old-school method that sidesteps KH entirely, and it is worth learning alongside the chart. Here is the procedure:
- Take a sample of tank water in a clean container.
- Aerate it vigorously for 24–48 hours — an airstone and a small pump, or vigorous shaking several times a day. This drives dissolved CO2 out of the water until it reaches equilibrium with the atmosphere (about 2–3 ppm).
- Measure the pH of this degassed sample. This is your baseline pH.
- Now measure the pH of your tank at the same time of day you would normally chart. The drop from baseline tells you your CO2 level.
The rule of thumb: a 1.0 pH drop from the degassed baseline corresponds to roughly 30 ppm CO2. A 1.2–1.3 drop puts you around 40 ppm or more. Driving off CO2 raises the pH back to what it would be with only atmospheric CO2 present; re-dissolving CO2 in the tank drops it again by an amount proportional to the log of the CO2 ratio.
Use this as a cross-check against the chart. If the chart says 30 ppm and the pH-drop method says roughly 1.0 drop from baseline, the two independent methods agree and you can trust the reading. If they wildly disagree, something in your assumptions is off — usually a hidden buffer.
Where the Chart Lies to You
This is the section that actually matters. The chart's math assumes carbonate is the only thing buffering your water. In many real tanks, it is not. When other acids or buffers are present, the formula reads their pH effect as CO2 and hands you a fantasy number.
Buffering/active aquasoils
Active soils like ADA Amazonia are designed to strip KH toward zero while pulling pH down. This breaks the chart completely: with KH near zero, the formula's output is meaningless, and the lowered pH produces enormous phantom CO2 values that do not exist. If you run aquasoil, do not use the chart at all. Rely on a drop checker instead, and watch your livestock.
Driftwood tannins and peat
Tannic and humic acids from driftwood, leaf litter, and peat filtration lower pH without adding any CO2. The chart reads the lowered pH and multiplies it by your KH, inflating the estimate — sometimes dramatically in blackwater-style tanks. If your tank is tea-colored, treat chart readings as overestimates.
Phosphate buffers
Some pH-adjusting products and certain fertilizers use phosphate buffers, which affect pH in ways the carbonate-only formula cannot account for. If you dose pH Up / pH Down style products or heavy phosphate buffers, the chart is unreliable.
KH near zero and RO water
With reverse-osmosis or very soft water where KH reads at or near zero, the formula degenerates and unstable pH makes readings noisy. KH must be a real, measurable number (ideally 2 dKH or more) for the method to have any meaning.
The pattern across all four cases is the same: the chart answers the question "how much CO2 is implied by this pH and KH if carbonate were the only buffer?" — and reality often ignores the "if." Knowing when your water violates the assumption is what separates a useful tool from a dangerous one.
Chart vs Drop Checker vs pH Controller
Three classic tools, three different philosophies.
The pH/KH chart
Wins on cost, speed, and calibration. Two cheap test kits you probably already own, five minutes, a number. Best used as a sanity check when setting up injection, cross-checking other methods, or troubleshooting a CO2 system for planted tanks. Loses badly in any tank with non-carbonate buffers — it is a snapshot, one reading per test, no continuous monitoring.
The drop checker
A glass bulb of 4 dKH reference solution and bromothymol blue sits in the tank and slowly reflects real dissolved CO2 as blue, green, or yellow. It works independently of your tank's buffering chemistry because it brings its own known KH, so it is immune to the aquasoil and tannin problems that defeat the chart. It is slow (1–3 hour lag), but for day-to-day monitoring it is the standard for a reason.
The pH controller
A probe reads pH continuously and a controller opens or closes the solenoid to hold a target pH. But it inherits every limitation of the chart — it is just a pH reading with a solenoid attached. In aquasoil tanks or driftwood-heavy water, a controller can chase a pH target while dumping unsafe amounts of CO2, because it cannot distinguish carbonic acid from tannins. It needs disciplined probe calibration, and a probe failure can gas your fish overnight.
The honest hierarchy for most hobbyists: drop checker for daily monitoring, chart for sanity checks and setup, controller only if you know exactly what you are doing. If you are considering whether your tank even needs injection at this point, read up on whether aquarium plants actually need added CO2 before buying hardware.
A Safe CO2 Dial-In Routine Using the Chart
Here is how to use the chart as what it is — a sanity check — inside a genuinely safe dial-in routine:
- Confirm your water qualifies. KH reads 2 dKH or higher, no aquasoil, no pH-adjusting products, minimal tannins. If any of these fail, use a drop checker instead.
- Start low. Set the bubble rate to roughly one bubble every 2–3 seconds for a mid-size tank. CO2 on 1–2 hours before lights on; surface agitation balanced against CO2 retention should stay gentle but present.
- Test after 3 days. Take pH and KH mid-photoperiod, run the chart. If it shows under ~20 ppm, you have headroom — but only if fish look completely relaxed.
- Raise slowly, one small step every 3–4 days. Recheck the chart each step. Aim for the 25–35 ppm band, but let livestock be the final judge, not the number.
- Watch the fish, always. Gasping at the surface, rapid gill movement, lethargy, or shrimp climbing the walls mean back the CO2 off immediately — regardless of what any chart, checker, or calculator says. Cross-reference with a CO2 and fish safety guide so you know the warning signs.
- Increase surface agitation at night when CO2 is off. Plants consume oxygen and produce CO2 in the dark; a little extra ripple protects against nighttime oxygen dips.
If you are injecting via a DIY CO2 setup for aquarium plants or supplementing with liquid carbon dosing, the same routine applies — the chart measures dissolved CO2 regardless of how it got there. And once levels stabilize, you can learn what plant pearling really means as a visual cross-check that photosynthesis is running hot.
Frequently Asked Questions
Is the pH/KH/CO2 chart accurate?
It is accurate only when its core assumption holds: carbonate must be the only buffer in the water. In plain tap-water tanks with measurable KH and no aquasoil, tannins, or phosphate buffers, it gives a genuinely useful estimate within the error of your test kits. In tanks that violate the assumption, it can be wrong by large margins — treat it as a sanity check, not a scientific instrument.
Why does the chart give a huge CO2 reading in my aquasoil tank?
Active aquasoils strip KH toward zero while dragging pH down. With near-zero KH and a low pH, the formula produces enormous phantom CO2 numbers that reflect soil chemistry, not dissolved gas. This is the chart's most famous failure mode. In aquasoil tanks, ignore the chart entirely and use a drop checker plus careful livestock observation instead.
What CO2 level should I aim for in a planted tank?
Most high-tech planted tanks target roughly 25–35 ppm of dissolved CO2, where plant growth is strong and the risk to fish stays low. Fish stress symptoms typically begin well above 40 ppm. But treat these as reference ranges, not targets to chase — livestock behavior outranks any number. If fish gasp or slow down, reduce CO2 regardless of what the chart claims.
How often should I test pH and KH for the chart?
Test both at the same time of day, mid-photoperiod, whenever you are adjusting your CO2 — daily while dialing in a new setup, then weekly or whenever you change something (new fertilizer, new driftwood, different water source). There is no need to chart daily once levels are stable; a drop checker covers continuous monitoring better than repeated test kits do.
Can I use the chart if my KH is 1 dKH or lower?
Not reliably. Near-zero KH makes the formula's output meaningless and your pH readings unstable enough that small errors swing the estimate wildly. You need a real, measurable KH — ideally 2 dKH or more — for the chart to mean anything. With RO or very soft water, remineralize to a stable KH or switch to a drop checker with 4 dKH reference solution.
Does the chart work if I run CO2 only during the day?
Yes — the chart is a snapshot method, so just take your pH and KH readings mid-photoperiod while CO2 is running at its normal rate. The standard practice of starting CO2 an hour or two before lights-on means a reading taken a few hours into the light cycle represents your peak dissolved CO2. Avoid testing right after the CO2 switches on or off.
The Chart Is a Compass, Not a GPS
The pH/KH/CO2 chart has survived decades of hobby gadgetry for a reason: two cheap tests, one lookup, and you know roughly where you stand. Its arithmetic is checkable, and its degassed-baseline cousin gives you an independent cross-check needing no KH reading at all. Learn its blind spots — aquasoil, tannins, phosphate buffers, near-zero KH — trust livestock behavior over any number, and dial in slowly.
Tissue-culture plants are the exception — they’re grown in sterile gel and adapt with minimal melting, which is part of what you’re paying for. Plants bought submersed from another hobbyist’s tank also transition with little melt, since they’re already in the right form.
Which Plants Melt Most (and Least)
Heavy melters (expect significant leaf loss)
- Cryptocorynes — infamous for “crypt melt,” sometimes dropping every leaf after any disturbance. They almost always recover from the roots within weeks.
- Stem plants grown emersed — rotala, ludwigia, and hygrophila often shed lower emersed leaves while the growing tips transition.
- Amazon swords — emersed-grown swords typically lose their broad oval aerial leaves and replace them with longer submersed ribbon leaves.
Light melters
- Anubias, java fern, bucephalandra — slow-growing rhizome plants transition gradually; occasional old-leaf melt but rarely dramatic.
- Vallisneria — usually transitions well, though it dislikes the move itself and may sulk for a week.
- Floating plants — minimal melt since their leaves were already at the air-water interface.
The Acclimation Protocol
Step 1: Quarantine or dip first
Before acclimating to your tank’s conditions, make sure you’re not acclimating pests along with the plant. Run new arrivals through our quarantine and dip protocol — it adds days upfront but prevents months of regret.
Step 2: Float to temperature-match (30 minutes)
Float the bag or container in your tank for 20–30 minutes to equalize temperature. Plants are less temperature-sensitive than fish, but a 10°F shock on top of transplant stress is an avoidable insult.
Step 3: Trim before planting
Remove any leaves that are already damaged, yellowing, or heavily algae-covered — they won’t recover and they’ll rot in your tank, feeding algae. For stem plants, trim off the bottom inch and any emersed leaves that look unlikely to adapt; the plant wastes energy maintaining leaves it’s going to shed anyway. Keep the healthy growing tips — that’s where recovery starts.
Step 4: Plant correctly the first time
Follow our planting guide — right depth, crown exposed on rosettes, rhizomes unburied on epiphytes. Every uprooting and replanting restarts the acclimation clock, so get placement right on the first attempt. Decide where each plant goes before it goes in the water.
Step 5: Run a gentle first week
For the first 7 days after planting:
- Moderate light — run your normal photoperiod but consider dropping intensity 20–30% if your light is dimmable. Blast-level light on a melting plant grows algae on the dying leaves, not recovery.
- Stable CO2 — if you inject CO2, keep it consistent. Fluctuating CO2 during acclimation is a melt accelerator. If you’re low-tech, this doesn’t apply — see growing without CO2.
- Half-strength fertilizer — new plants with damaged leaves can’t use full dosing, and the excess feeds algae. Ramp to full strength over 2–3 weeks per our fertilizer schedule.
- No disturbance — don’t move, trim, or “check on” new plants for at least two weeks. Every touch resets root establishment. This is especially critical for crypts.
Step 6: Remove melt, keep the base
As emersed leaves melt, remove the mushy material promptly — decaying leaves release ammonia and grow fungus that can spread to healthy tissue. But never discard the plant while the crown, rhizome, or roots are firm and alive. A crypt that’s lost every leaf but has firm roots is a plant that’s about to recover, not a dead plant. Give it 3–4 weeks before judging.
Telling Normal Melt From Real Problems
Normal transition melt:
- Affects oldest/emersed leaves first, newest growth last
- New submersed leaves emerge even as old ones dissolve
- Roots and crown stay firm and white/green
- Timeline: 1–4 weeks, then obvious new growth
Concerning melt (see our full melting diagnosis guide):
- New growth also melts or emerges deformed
- Rhizome or crown turns mushy and brown — this is rot, not transition
- Entire plant dissolves within days with no new growth after 4+ weeks
- Melting spreads to established plants that weren’t recently moved
Buying Tips to Minimize Melt
- Buy submersed-grown when available — hobbyist-grown cuttings transition with almost no melt.
- Choose tissue culture for sensitive species — crypts and delicate stems establish far more reliably from sterile cups.
- Avoid plants already melting in the store tank — some melt is normal, but a plant that’s mostly mush at purchase has less energy for recovery.
- Transport carefully — keep plants damp and out of direct sun/heat. A plant that dries out or cooks in a hot car melts far worse than one transported properly.
The First-Month Timeline: What to Expect Week by Week
Knowing what’s normal when removes most acclimation anxiety. Here’s the typical timeline for a healthy plant adapting to a new tank:
Week 1: The quiet week
Almost nothing visible happens. The plant is growing roots you can’t see and assessing its new environment. Some species (vallisneria, stem plants) may start shedding their lowest leaves. This is normal. Resist the urge to “help” — no moving, no extra fertilizer, no light changes. The most common beginner mistake is intervening during a week when the correct action is nothing.
Week 2: Melt peaks
This is when emersed leaves give up in earnest. Crypts may drop everything; swords shed their broad aerial leaves; stem plants lose lower foliage. It looks catastrophic and it’s usually fine. Keep removing mushy material, keep conditions stable, and watch the crown and growing tips — if those are firm and green, recovery is already underway.
Week 3: The turn
New submersed-adapted leaves emerge — smaller, thinner, often a slightly different shade of green than the emersed foliage. Stem plant tips start growing visibly; crypts push tiny curled leaves from the crown; swords unfurl narrow ribbon leaves. This is the moment most beginners exhale for the first time.
Week 4+: Established
New growth outpaces melt, and the plant is functionally yours. You can resume full-strength fertilizer, normal trimming, and stop treating it as fragile. Some slow growers (anubias, bucephalandra) take 6–8 weeks to show obvious progress — that’s their normal speed, not a problem.
Acclimating Different Plant Formats
Tissue-culture cups
Sterile, pest-free, and already adapted to high-humidity (not emersed) growth — tissue cultures melt the least of any format. Rinse the agar gel off gently (leftover gel rots and feeds fungus), split the portion into small plantlets, and plant per our planting guide. They establish slowly for the first two weeks, then accelerate. No dip needed, minimal acclimation stress — this is the premium experience you’re paying for.
Potted plants
Remove the pot and strip away the rockwool completely — leftover rockwool traps debris and rots. Tease the root mass apart gently; if it’s a dense mat, splitting it into 2–3 smaller portions actually establishes faster than planting one big clump (more growing points, better water flow around roots). Potted plants are usually emersed-grown, so expect the standard 2–4 week melt cycle.
Bare-root / bunched stems
Typically sold as weighted bunches. Remove any bands, foam, or weights, strip the lower leaves, and plant stems individually or in small groups. Bunched stems from the store are often already transitioning — check for new submersed growth at the tips, which tells you the plant is mid-adaptation and will settle quickly.
Hobbyist cuttings
Already submersed-grown and the fastest to establish — often showing new growth within days. The main acclimation factor is water-parameter difference between the two tanks. Float to temperature-match, plant promptly, and they’ll usually take off with minimal melt. This is why experienced hobbyists prefer trading cuttings over buying potted plants.
Frequently Asked Questions
Should I use a “plant starter” or transplant fertilizer?
Products marketed for transplant shock are mostly B-vitamins and mild hormones. They don’t hurt, but there’s no strong evidence they help aquarium plants specifically. Stable conditions and patience outperform any bottle. Save the money for more plants.
My new plant melted completely — bare crown, no leaves. Is it dead?
Probably not, if the crown or rhizome is firm. Crypts and swords routinely lose 100% of their leaves and regrow from the base within a month. The test is firmness: firm and pale/green means alive; mushy and brown/black means rot. Give firm-but-leafless plants a full 4 weeks before declaring them dead.
Can I speed up acclimation with extra light or CO2?
No — and trying usually backfires. A melting plant can’t use extra light; the excess just grows algae on its dying leaves. Keep light moderate and CO2 stable (not boosted) during acclimation. Growth speed comes from the plant’s own adaptation timeline, which you can’t rush, only avoid delaying.
Should new plants go straight into my main display tank?
After quarantine/dipping, yes — there’s no benefit to a separate “growing-in” tank for most plants. They acclimate to your water fastest in the tank they’ll live in. The exception is very delicate species going into a tank with boisterous fish; give those a few weeks in a calm corner or breeder box first.
The Patience Rule
The single most important acclimation skill is restraint: plant it right, set gentle conditions, remove decay, and then leave it alone for a month. The hobbyists with the best plant growth aren’t doing something clever in week one — they’re simply not interfering in weeks two through four while the plants do what they’ve evolved to do. Melt looks like failure and feels like failure, but in most cases it’s the visible part of a plant successfully becoming yours.